The Road to Lower Inflation Takes a Detour
The rate of inflation is accelerating. That’s not how we hoped to start this week’s Insights.
Take a moment and review Figure 1. The 4-month moving average has broken out of its long-term downward trend (red-dashed lines). On a monthly basis, prices bottomed in June and began to gradually turn higher. The upward trajectory picked up in January.
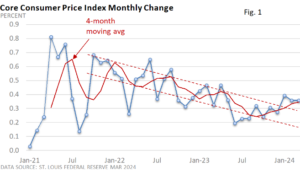
But, what about the so-called calendar effect? Wasn’t the bump in January and February tied to the new year? Well, apparently not.
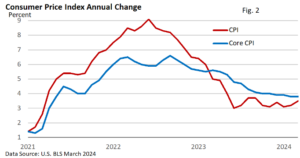
The Consumer Price Index rose 0.4% in March. It’s up 3.5% versus one year ago. In February, it was up 3.2%.
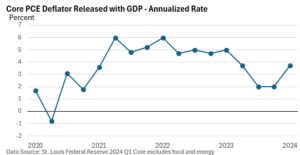
The core rate, which excludes food and energy, rose 0.4%. It’s up 3.8% year-over-year, the same as February—see Figure 2.
Inflation has slowed dramatically on an annual basis. That is important to acknowledge. But price hikes remain elevated. Using the year-over-year rates as our yardstick, progress toward price stability (defined by the Federal Reserve as 2% annually) has stalled.
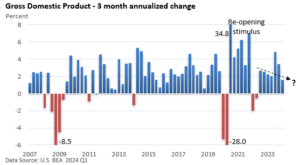
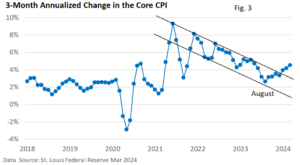
Let’s review another metric. The 3-month annualized rate can be noisier and more volatile, but it can detect new trends faster than the year-over-year rate. Like the monthly core CPI, it has also turned higher, bottoming out at 2.64% in August and rising to 4.53% in March. It has risen in six of the last seven months.
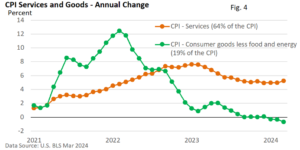
What’s happening? U.S. BLS data highlight that the price of consumer goods, excluding food and energy, are declining—yes, that’s right, declining. Goods are in a slight deflationary trend (Figure 4). But services are much higher and are showing signs of accelerating.
At best, the road to lower inflation isn’t hitting bumps; it’s taken an unexpected detour. At worst, inflation is moving higher, and we’re repeating the mistakes of the 1960s and 1970s. Or will inflation get stuck in the current range, denying the Fed the ability to start cutting rates?
Following the runup in stocks, some volatility shouldn’t be discounted. The latest CPI report is forcing a shift in sentiment on rate cuts, which is creating short-term volatility.